Understanding the rising speed of plastic
Back to updatesThe Ocean Cleanup Research Team continues to analyze data from our expeditions, including our Mega Expedition which provided us with the largest sample of ocean plastic ever collected (1.1 million particles weighing approximately one ton). One of the many experiments conducted was measuring the rising speed of plastic particles.

WHY DO WE NEED TO KNOW THE RISING SPEED OF PLASTIC?
Quantifying the amount of plastic in the Great Pacific Garbage Patch is crucial to develop the most efficient and effective technology. Increasing our knowledge on the physical properties of ocean plastic results in a more accurate estimate of the total load of plastic in the garbage patch and how much of this plastic our barrier will be able to collect.
We need to understand the buoyancy differences across all size classes and types of plastic. Buoyancy helps us understand how the plastic is vertically distributed, moves in the ocean and to anticipate its behavior when interacting with our technology. While mapping and quantifying the amount of plastic in the gyre, the rising speed helps us correct our measurements by accounting for the vertical mixing the particles encounter in the gyre. Our engineering team uses the rising speed for computer modelling during the design process to determine the optimal length of our boom’s impermeable skirt.
HOW TO MEASURE RISING SPEED?
The setup of the rising speed tests differed for micro, meso and macro plastics but the protocol remained consistent. For the experiments, four types of plastic (hard fragments, lines, foam and pellets) for every one of the eight size classes were selected from multiple Mega Expedition sampling events.
All three experiment setups provided a distance in which the particle could reach its terminal velocity before measuring its rising speed. The rising speed of the lines and fragments were measured three times, and the median value was used for further analysis.
Microplastic (0.05 cm- 0.5 cm)
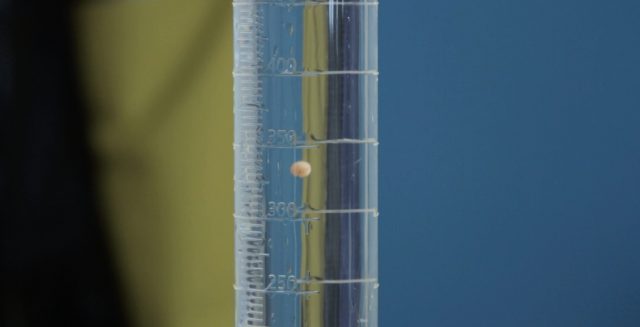
Microplastics were tested in the lab with a closed airtight cylinder. The particle reached terminal velocity and the fixed remaining distance was used to record time using a chronometer.
Mesoplastic (0.5cm – 10cm)
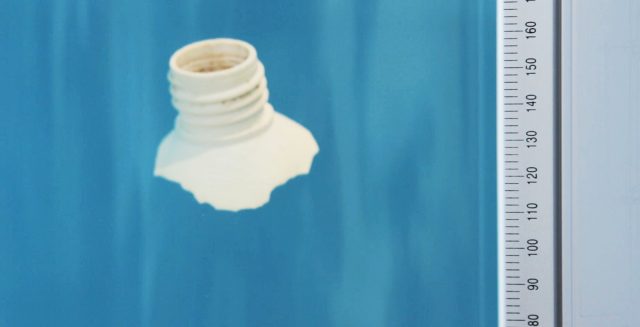
Mesoplastics were tested in the lab in a large cylindrical tank. The particles were released one by one with a custom designed releasing system attached to the bottom of the tank. Once the plastic particle reached its terminal velocity, time was measured with a chronometer from a fixed marking line to the water’s surface.
Macroplastic (>10cm)
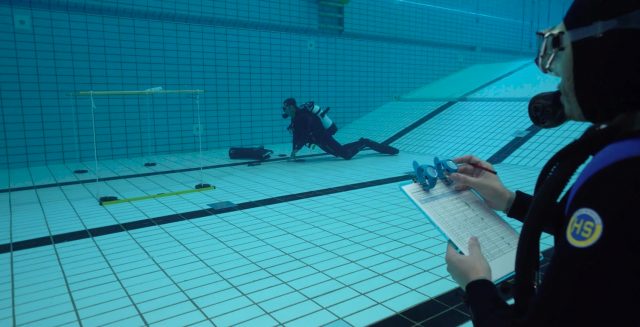
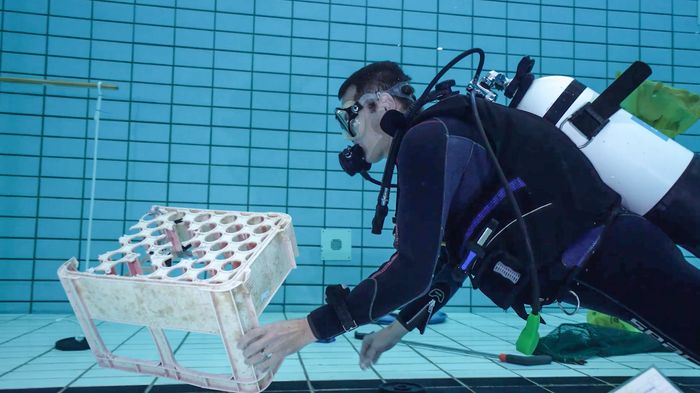
Due to the size, the particles were tested in a local freshwater swimming pool (Kerk Polder Zwembad). As the swimming pool contained fresh water, we estimated the salt water rising speed with a correlation factor. To calculate this correlation factor, 75 mesoplastic particles had their rising speeds measured both in fresh and salt water in our lab’s cylindrical tank.
A horizontal pole in the water was used to mark the start of each measurement. Each particle reached terminal velocity and then we measured with a chronometer from the fixed pole to the water’s surface. Professional divers from Get Wet Maritiem helped our team perform these tests to ensure accuracy.
WHAT WE’VE LEARNED AND NEXT STEPS
We expect the total load of plastic in the Great Pacific Garbage Patch will be higher than previously estimated. The collected data continues to help us calibrate computer models to map the plastic pollution problem as well as support our engineering team with insightful data for the design of our pilot system.
