Using AI to Monitor Plastic Density in the Ocean
Back to updatesA key objective for our Research Team is to provide data-driven insights to help us determine optimal locations for cleanup operations. New technology and tools that use artificial intelligence (AI) are helping us to create detailed maps of plastic densities in remote ocean locations. The current datasets were built using conventional methods (trawls) that are very labor-intensive, or less conventional methods (airplane) that are very costly and complex to organize. The Research Team has developed a more intelligent and effective manner to detect and monitor plastic debris. The team has worked on AI object detection software for more than two years. This software, combined with automated time-lapse image series along GPS-tagged transects, creates a remote sensing approach to detect and map the dynamic behavior of floating ocean plastic more efficiently. Ultimately, this growing dataset will help us determine where to deploy cleanup in an extensive area with an uneven distribution of plastic debris.
Using GoPro cameras on ships, we successfully scanned a track of hundreds of miles for marine debris. We processed the dataset with our new AI object detection algorithm, which revealed more than 400 large plastic items in the GPS-tagged images taken by the cameras. By analyzing the item locations, we distilled a numerical concentration map.
In summary, this is a new tool that can generate scientific observations of floating macroplastic litter. Our findings, ‘Quantifying Floating Plastic Debris at Sea Using Vessel-Based Optical Data and Artificial Intelligence,’ were published in MDPI Remote Sensing in August 2021 – and they form the first proof of concept of this new method of remote-sensing plastic detection. Until now, most of our ocean plastic research has relied on manual and on-site observation for data acquisition. Remote sensing could become a new tool to monitor floating ocean plastic continuously and systematically in offshore regions.
WHY IS THIS IMPORTANT?
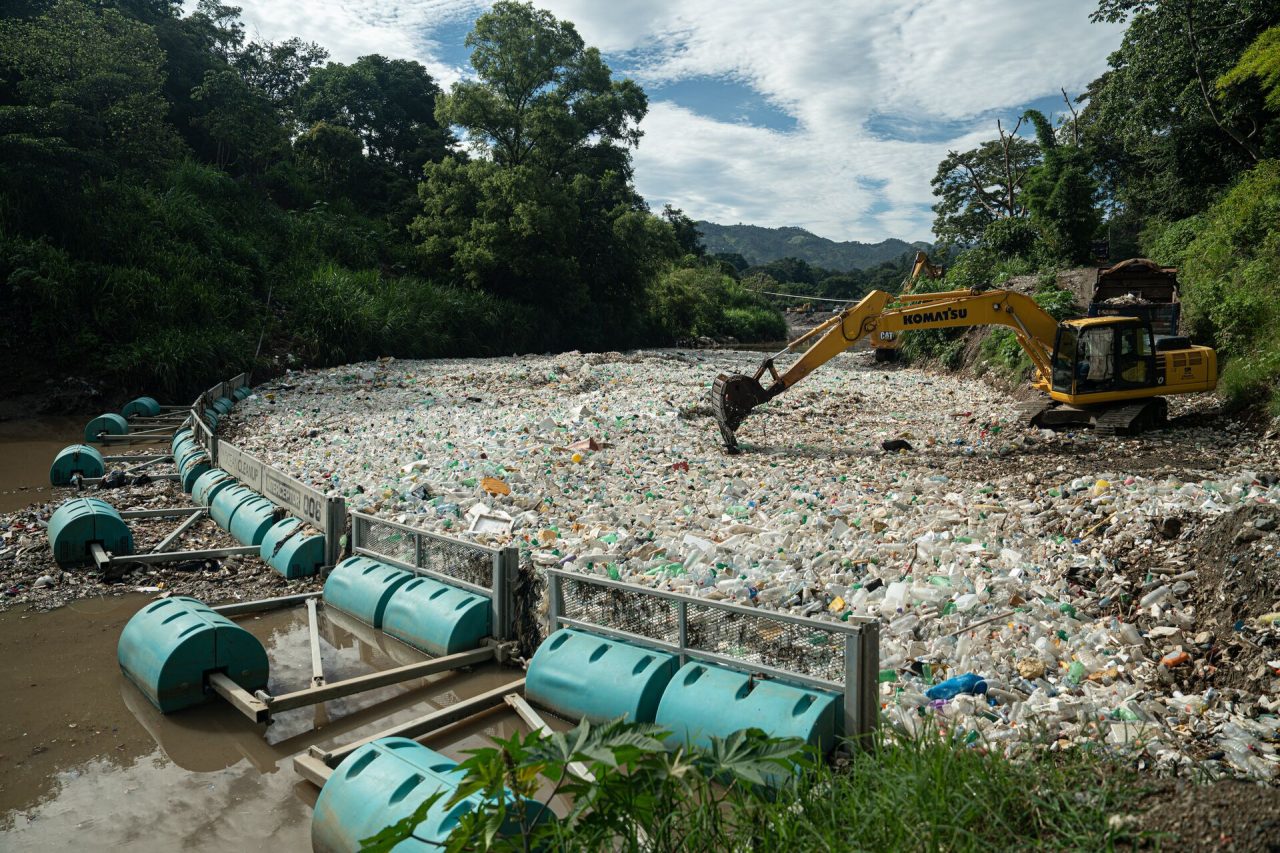
To solve the plastic pollution problem, we must first understand its dimensions. Knowing how much and what kind of plastic has accumulated in the ocean garbage patches is especially important. This knowledge determines the design of cleanup systems, the logistics of hauling plastic back to shore, the methods for recycling plastic, and the costs of the cleanup. And – since we are now using active propulsion on our cleanup systems while we know that the plastic is not evenly distributed over the patch – having a ‘map’ of the plastic and its ‘hot spots’ of concentration would allow us to direct our cleaning efforts to where most plastic is.
As a result of our research, we already know that most plastic in weight is concentrated in larger, microplastic objects. Floating macroplastic litter are large plastic items (over 50 cm in size) that float in the ocean. An essential challenge in mapping the pollution is that these objects do not occur as frequently as microplastic pieces. On average, you may only encounter between one and ten items per square kilometer in the Great Pacific Garbage Patch (GPGP), vs. an abundance of microplastics. For example, 311 square kilometers of aerial photos were taken during the Aerial Expedition in 2016, revealing ‘only’ 1,500 objects. Because so much mass is concentrated in small numbers of items, even a slight variation in average concentration can tilt our understanding of the amount of debris in the GPGP. For this reason, we required new and actualized data about floating macroplastic.
The low concentration of macroplastics and their large size make them difficult to collect by commonly used methods, such as neuston trawls. In the Mega Expedition and Aerial Expedition, we used mega trawls on our mothership and visual observers on all other participating vessels to count large plastic items along transects. However, these methods are costly and labor-intensive to organize, let alone to repeat regularly. A more automated process using remote sensing will allow us to scan all five ocean garbage patches better and make repetitive scans, e.g. using fixed cameras on (commercial) ships.
TRAINING AN AI ALGORITHM
To take advantage of emerging remote-sensing technologies, we first need to identify, or detect, what we want to track. For us, the solution will rely on ‘object detection’ technology. Object detection has taken off rapidly in recent years. It is used in everyday life, e.g. in facial recognition on your mobile phone. Object detection is a specific category of AI in which a computer identifies an object of interest within an image.
For AI to work, it needs to be trained to conduct a specific task. Training for AI object detection relies on vast amounts of input images – the more you include, the more accurate the software becomes.
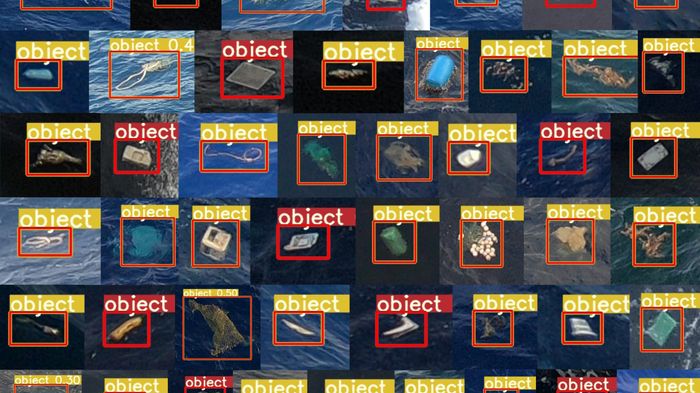
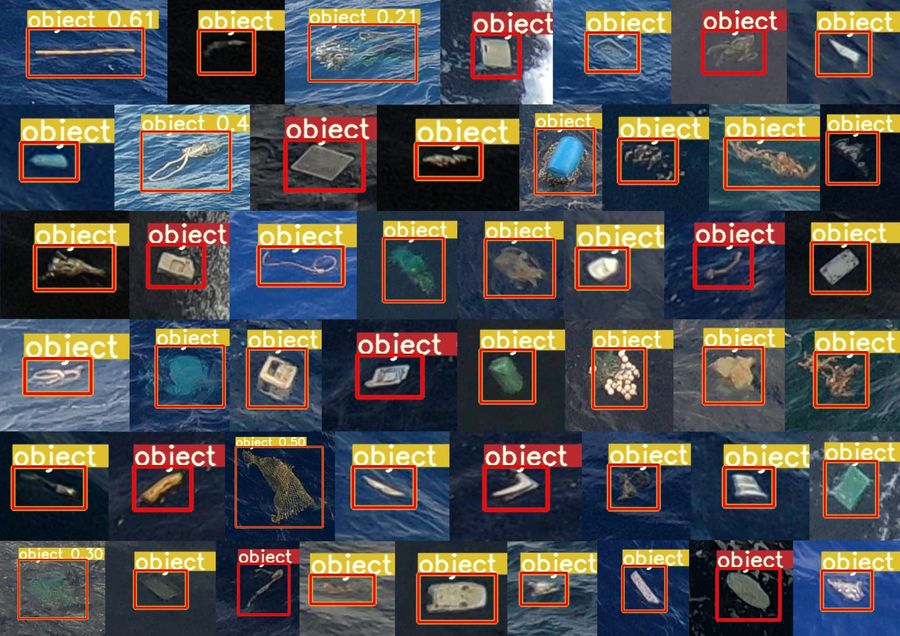
The working mechanism behind object detection in images is an artificial neural network. This is a set of mathematical equations with slightly different settings called weights. The weights are tuned by feeding example images to the neural network thousands of times, and the neural network slowly learns to recognize the objects in the example. To provide the required training images, we labeled roughly 4,000 example objects in photos from our previous missions on the Aerial Expedition (2016) and our trip with System 001 (‘Wilson’) in 2018. Labeling is a tedious process, during which volunteers helped us to draw bounding boxes around every object. After this, we applied a trick: we transformed the images so that we could present them as new objects for the AI training. This process is also known as data augmentation, resulting in a dataset of 18,589 images that are ready to use.
Several labeled objects after the data augmentation step
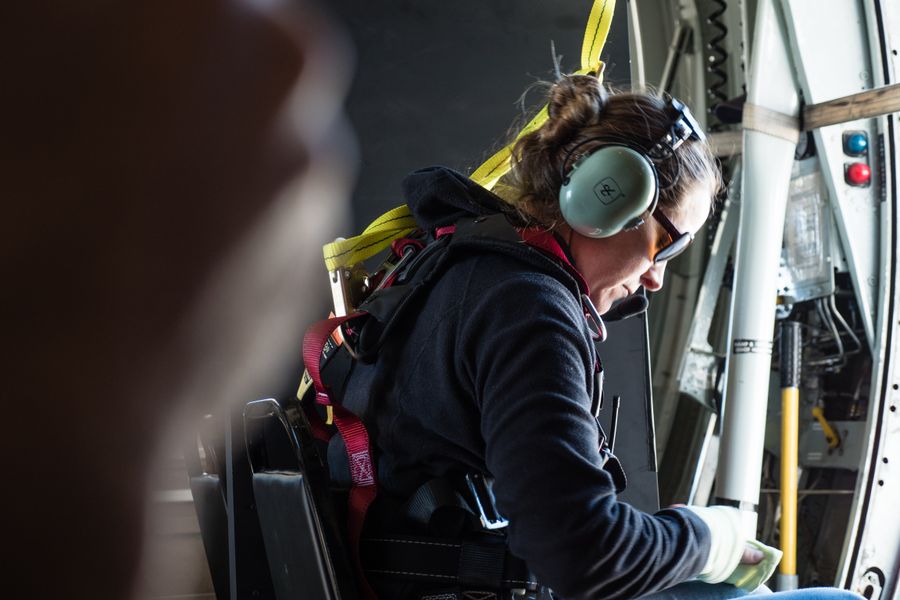
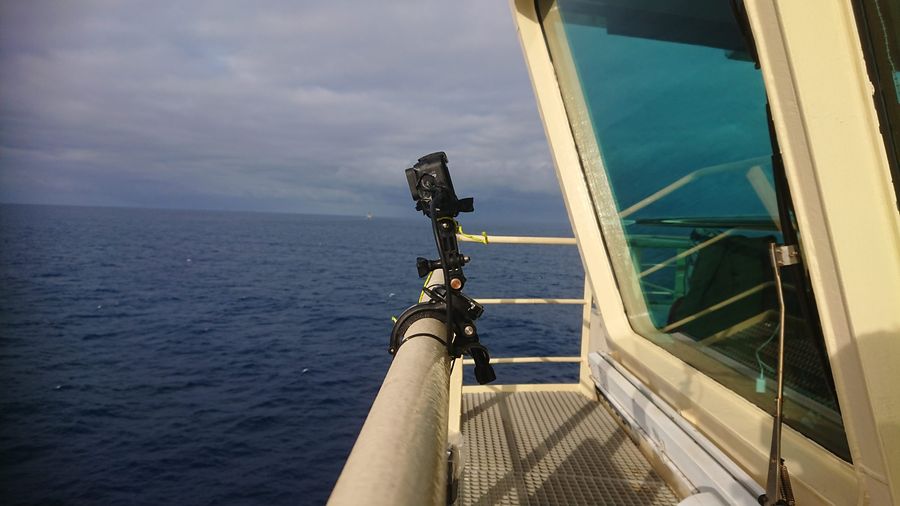
During the mission with System 001/B in 2019, the team collected a new dataset onboard Maersk Transporter. Two GoPro cameras were set up starboard and portside on the vessel’s bridge. Together, they shot over 100,000 photos in time-lapse mode. Most images only show waves and water, but some show floating litter objects. The pictures are also geotagged, which means that each photo has its unique GPS coordinates.
BUILDING AND RUNNING A PROCESSING FLOW
The processing software also determines the camera orientation based on the horizon’s position in the image. With this orientation, we can construct a projection of the image on the sea surface. This extra information makes it possible to estimate an object’s size and distance from the vessel. We ran the trained AI on 600 GB of images, which took two days to complete. The AI generates a collection of ‘object suggestions’ as output. A human operator sorts the actual objects from the suggestions.
Looking through the algorithm: the green line denotes the detected horizon; a bounding box indicates the detection of a large ghost net
MAPPING OUR RESULTS
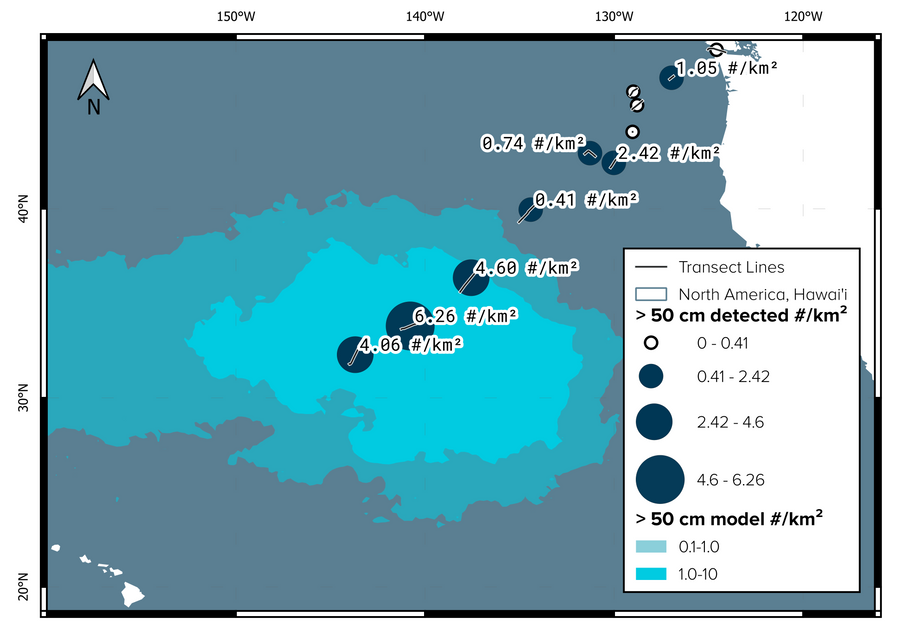
We know the location of each detected object by the GPS coordinate of the photograph it was detected in. We next group the GPS coordinates of photos (that contained verified objects) into different sectors. We obtain the estimated numerical density per transect by grouping detected objects in a transect and dividing this by its total area. The geometric projection function also reveals the object sizes and allows us to create a map of ocean plastic concentrations; our initial analysis focused on macroplastic objects − plastics over 50 cm in size, such as crates, ghost nets, and buoys.
A map of the numerical densities reveals a gradual increase of density toward the GPGP. The light- and dark-red polygons on the map indicate the modeled GPGP outlines for medium and high concentrations, respectively. Three data points fall into the high concentration zone, and their values (4.06 to 6.4) appear well in range of the model prediction of objects over 50 cm (one to ten per square kilometer). Together with the gradual increase, this indicates that the camera transect method can be used to survey macroplastic concentrations.
WHAT’S NEXT?
While the current publication is a proof of concept, more of our cameras at several locations offshore are collecting photographs now. To ground-truth our maps, we plan to simultaneously collect manta trawl, mega trawl, and GoPro data. When scaling up the image collection effort and bulk processing all the data, this method has the potential to create detailed maps of plastic densities in remote locations that we haven’t previously visited.