How Does Plastic End up in Rivers?
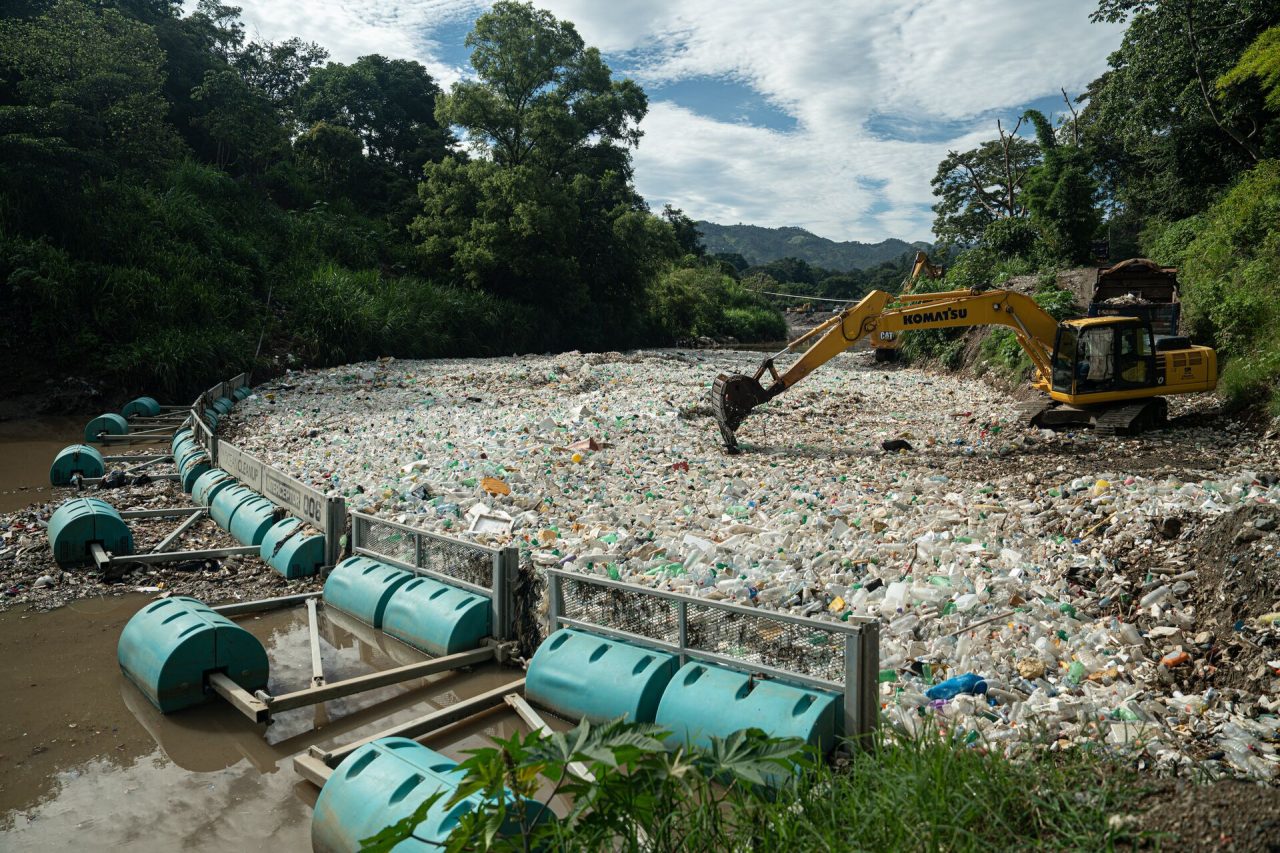
Back to updatesTo rid the world’s oceans of plastic, The Ocean Cleanup intercepts river plastic to stop the leakage alongside cleaning up legacy plastic in oceans. To help us target our river interception towards the most polluted places, we develop and refine global river models. Such simulations estimate the amounts of plastic that end up in rivers, and finally the oceans, and quantify how plastic behaves as it heads towards a waterway. These calculations need lots of field data for fine-tuning – and such data is hard to find. To fill this data gap we designed and conducted a laboratory experiment on an artificial hillslope with Wageningen University in the Netherlands. The study is published in Scientific Reports.
The Research Team at The Ocean Cleanup is continuously collecting empirical data to improve mathematical river models and understand how plastic behaves in water. Working in international collaborative case studies, the methods include drone surveys on river banks, camera monitoring and physical sampling in the water, as well as deploying GPS trackers in rivers. The goal of such studies is to generate data on river plastic sources, on floating plastic pollution and on the probable routes plastic takes through rivers. To understand how plastic is transported on land, however, modellers so far had only limited data based on systems using leaves, twigs and paper and from interviewing experts.
More precise plastic pollution forecasts are essential for policymakers, researchers and our own river interception operations. We therefore conducted a large experiment on overland transport in a wind and rainfall simulator. We asked the questions “how much wind or rain does it take to move plastic?”, and “once the plastic is in motion, how fast will it move on different surfaces?”.
HOW DID WE COLLECT THE DATA?
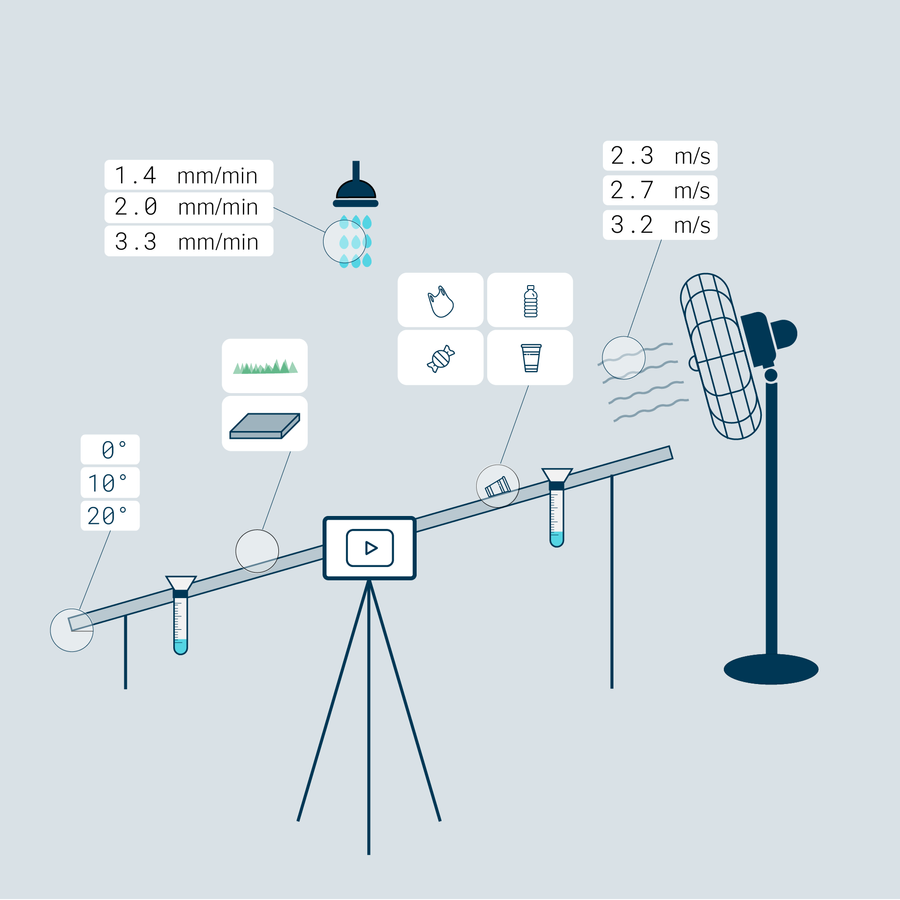
We placed bags, food wrappers, bottles, and cups – some of the most commonly found plastic types in the environment – on both paved and grass surfaces, at varying slope angles, in a simulator. In each experiment, we exposed the plastic items to either wind, generated by a wind fan, or rain, from nozzles, to see what was required to ‘mobilize’ the plastic – i.e., take the items from stationery to moving. We applied different wind speeds and rain intensities. All experiments were recorded on camera.
USING SPORTS VIDEO ANALYSIS TO MEASURE MOTION
To measure the movement of the plastic items we used the Kinovea software to track the position of an object in time and in space. Athletes and their coaches use this software to analyse their movements in cycling, snowboarding, high jumping and many other sports. Using this software, we turned video footage into numbers describing the movement of the plastics.
Video software, invented for analyzing sport performance, helped us track plastic waste in the wind or rain. The black dots on the bags make them easier to be tracked in the software.
HOW MUCH WIND OR RAIN DOES IT TAKE TO MOVE PLASTICS ON LAND?
Among all the tested plastic trash items, the light and thin plastic bags started moving easiest when exposed to wind, already at low wind speeds. A wind speed of Beaufort 3 – “gentle to moderate breezes” – was enough to mobilize 100% of the plastic bags. However, the same wind speed could not even move 50% of the other tested plastic trash items – perhaps why you see plastic bags (rather than laundry baskets) hanging from trees and bushes after strong winds. Concerningly, trillions of plastic bags are used worldwide every year, creating a highly mobile trash threat to waterways and the oceans.
Rain, on the other hand, barely mobilized any of the tested plastic trash items, regardless of the extreme rainfall events that we simulated. This suggests that it is not the rain itself that mobilizes plastics on land, but the surface runoff. To flush away plastic trash, a sufficiently deep layer of water needs to be present on land for the plastic to float on. We will test this further in future experiments.
Another important finding is the difference between smooth and rough ground surfaces. In windy conditions, plastic trash was 1.5 times more likely to start moving on the smooth paved surface than on the rougher grass. In the rain, certain plastic items were 6 times more likely to move on paved surfaces than on grass.
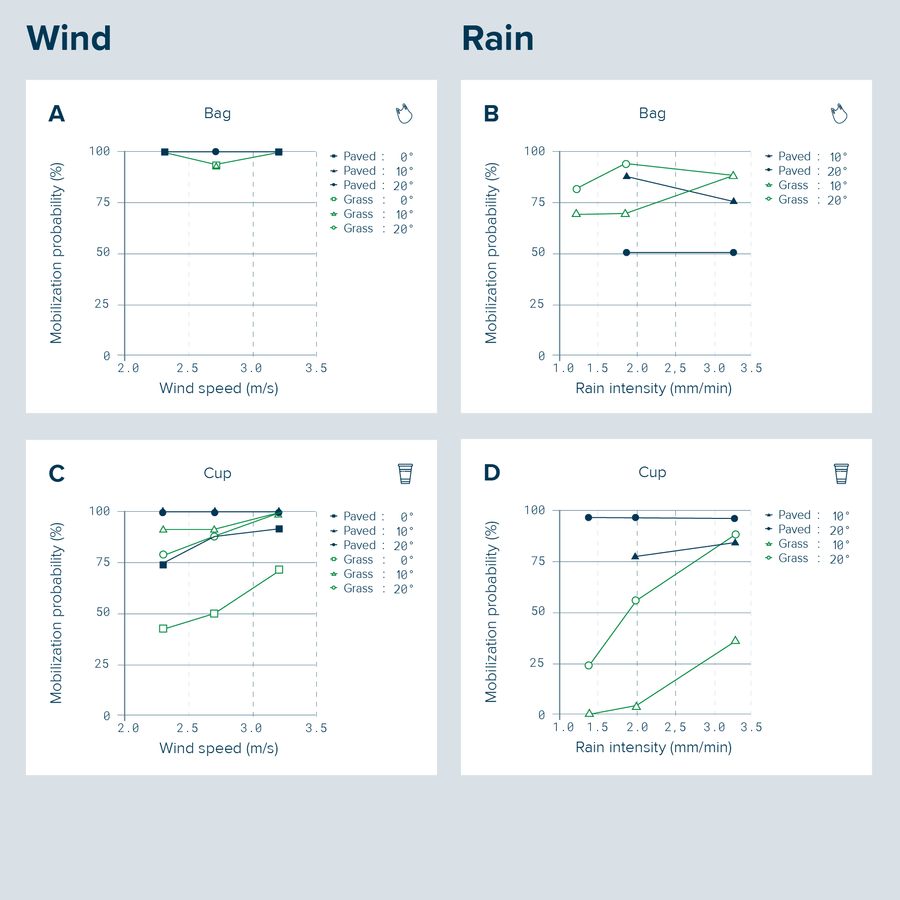
You might wonder: “how does the wind and rain in this experiment relate to the real world?”. For the wind we used “gentle to moderate breezes” of 3–4 on the Beaufort scale, as we noticed that this was already sufficient to get some plastic items moving. For the rain, however, we applied very rarely occurring “violent” intensities ranging up to 200 mm/hour. For comparison: some of New York’s highest recorded rainfalls were around 100 mm/h and Durban’s devastating floods of 2022 followed after 307 mm in 24 hours.
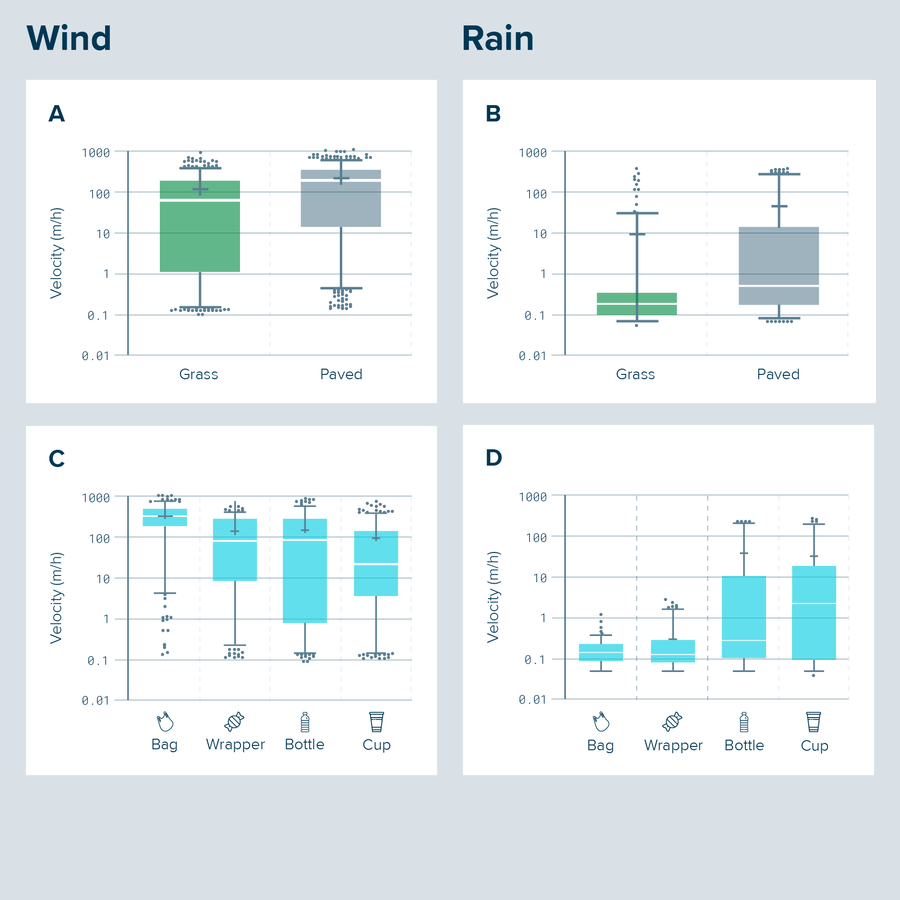
HOW FAST DOES PLASTIC MOVE ON LAND?
Once plastic is mobilized by wind or rain, its movement depends on its properties (such as mass and shape), the land surface and slope degree, and the wind speed or rain intensity. In the wind, the light plastic bags win the race under dry conditions, moving more than twice as fast as any other tested plastic item. However, when exposed to rain, the bags and snack wrappers lose by a mile as they become wet and stick to the ground
WHAT DO WE LEARN FROM THIS NEW DATA?
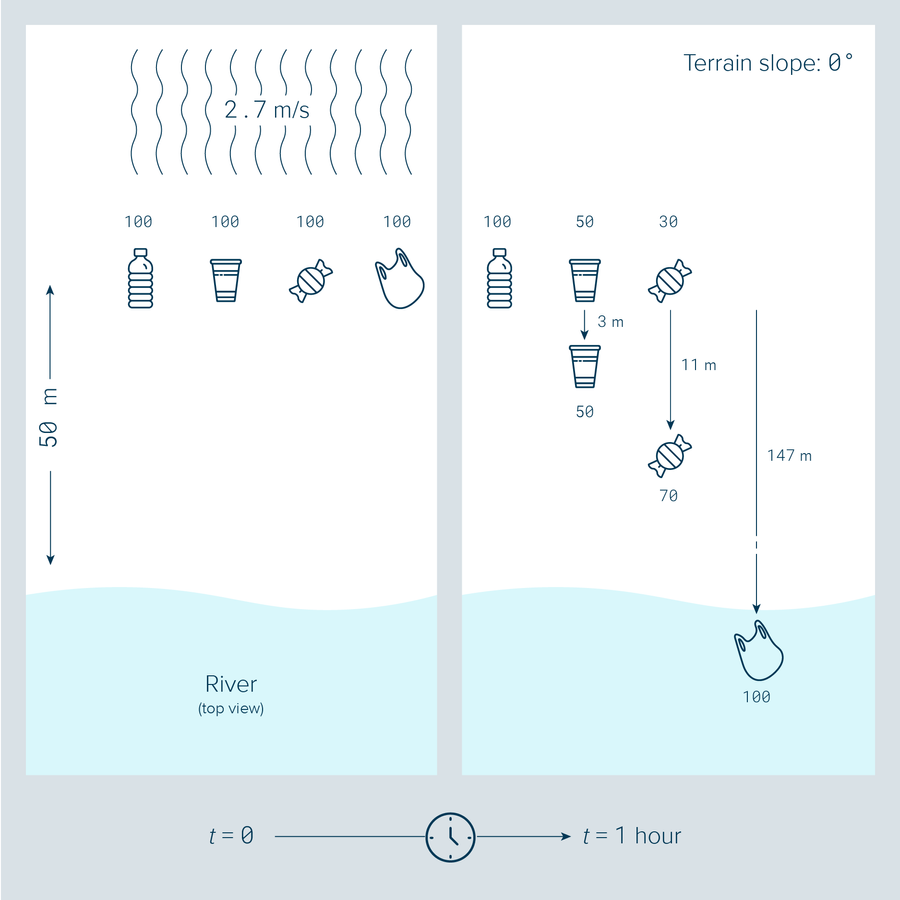
Our study is the first to provide empirical data about the effects of wind and rain on mobilization and transport velocity of larger plastic items on the ground. For example, it is useful for modellers to know that cups, wrappers and bags adopted only 2–5% of the prevailing wind speeds while tumbling along over land. The findings can help modellers quantify the differences between smooth and rough land surfaces, and between different plastic trash types. Our findings, for example, suggest, that from a pile of plastic trash, the bags would reach the river first when gusts of wind blow over the land.
Our data also allows us to check the assumptions that were used for modelling so far. It turns out that the mobilization probabilities we found for the wind were higher than the ones used in our global river model: 5 times higher on paved surfaces and 1.5 times higher for grass. Another land transport model estimated substantial plastic mobilisation on paved surfaces to only occur with winds above 9 m/s, but our data showed >70% mobilisation for most trash types already at wind speeds as low as around 5 m/s (for these comparisons the wind speeds were transformed to apply at 10 m above the ground). In contrast, our data on grass showed lower mobilisation than what was assumed by that same model.
This comparison of our empirical data with previously assumed model numbers is a good example of how models evolve with new data for calibration and validation. This experiment demonstrates the lengths we go to dive into the nitty-gritty of our models, to better lead The Ocean Cleanup to where the problem of plastic pollution in the environment most pressingly needs solving.